Chapter3 Exploratory Factor Analysis
3.1 Eigenvalues
# correlation analysis without mvliking
cor<- cor(vars[,-1])

EV = eigen(cor)$values
EV_df = EV %>%
  # convert to df
  as.data.frame()%>%
  # name column
  dplyr::rename(., "Eigen Value" =".") %>%
  # add a column "Factor"
  dplyr::mutate(Factor = seq(1,length(EV))) %>%
  # order columns
  dplyr::select(Factor, everything()) %>%
  # add a column "Variance"
  dplyr::mutate(`Variance %` = EV/length(EV) *100) %>%
  dplyr::mutate(`Cumulative Variance % ` = cumsum(EV/length(EV))* 100) %>%
  dplyr::mutate(., across(where(is.numeric), round, 1))

rmarkdown::paged_table(EV_df )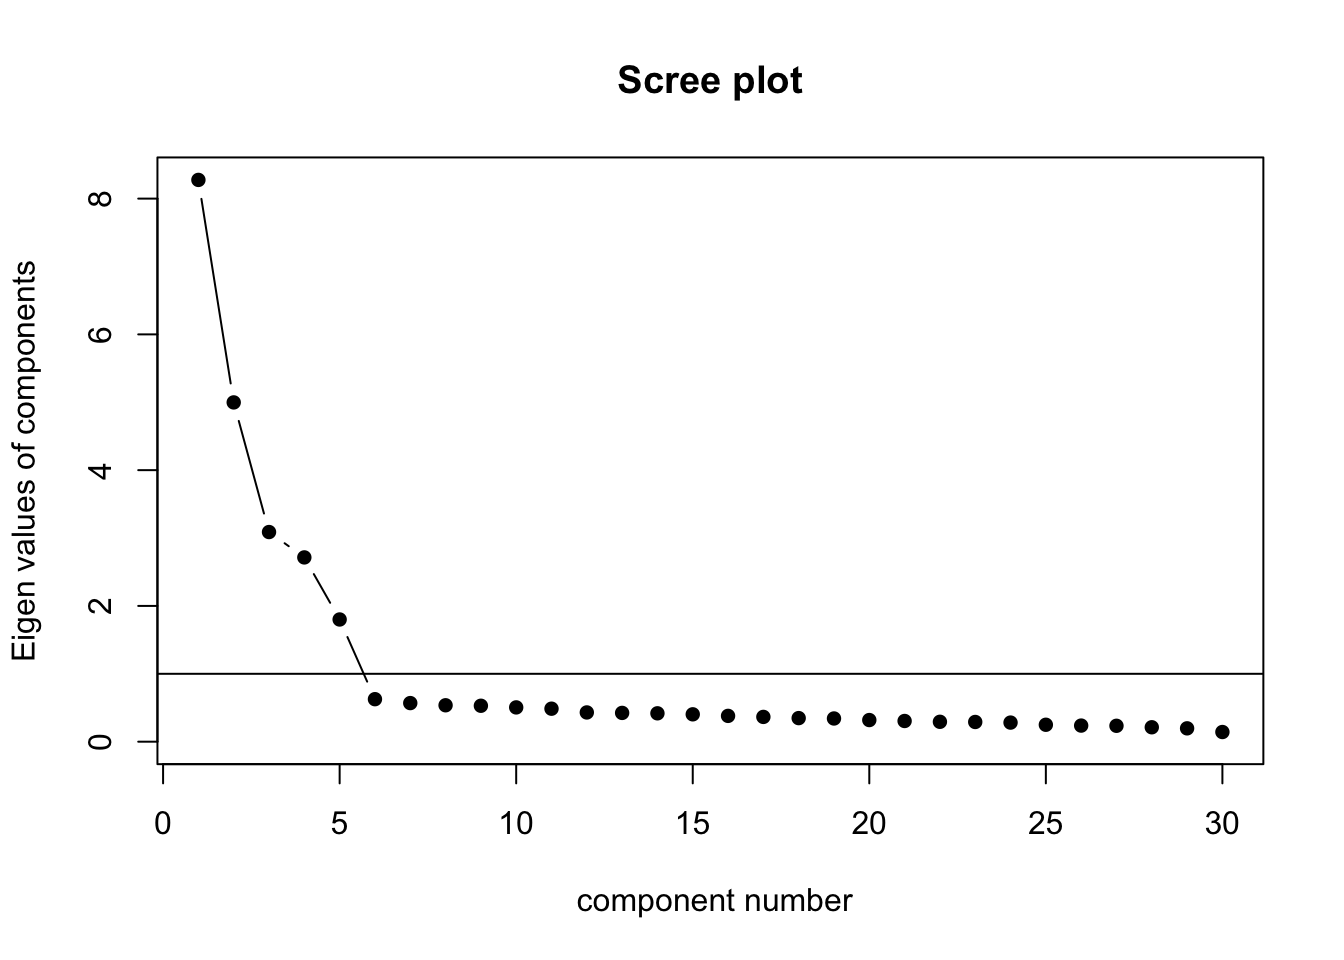
3.1.2 Cumulative Percentages of Variance
# Shares for the cumulative variance explained
plot(cumsum(EV/length(EV)),
     type = "o", # type of plot: "o" for points and lines 'overplotted'
     col = "darkblue",
     pch = 16, # plot symbol: 16 = filled circle
     cex = 1, # size of plot symbols
     xlab = "Total number of factors", # a title for the x axis
     ylab = "Cumulative variance explained", # a title for the y axis
    main= "Cumulative Variance",
     lwd = 2) # line width
abline(v = 5, lwd = 2, col = "grey") # draw a vertical line at v = 3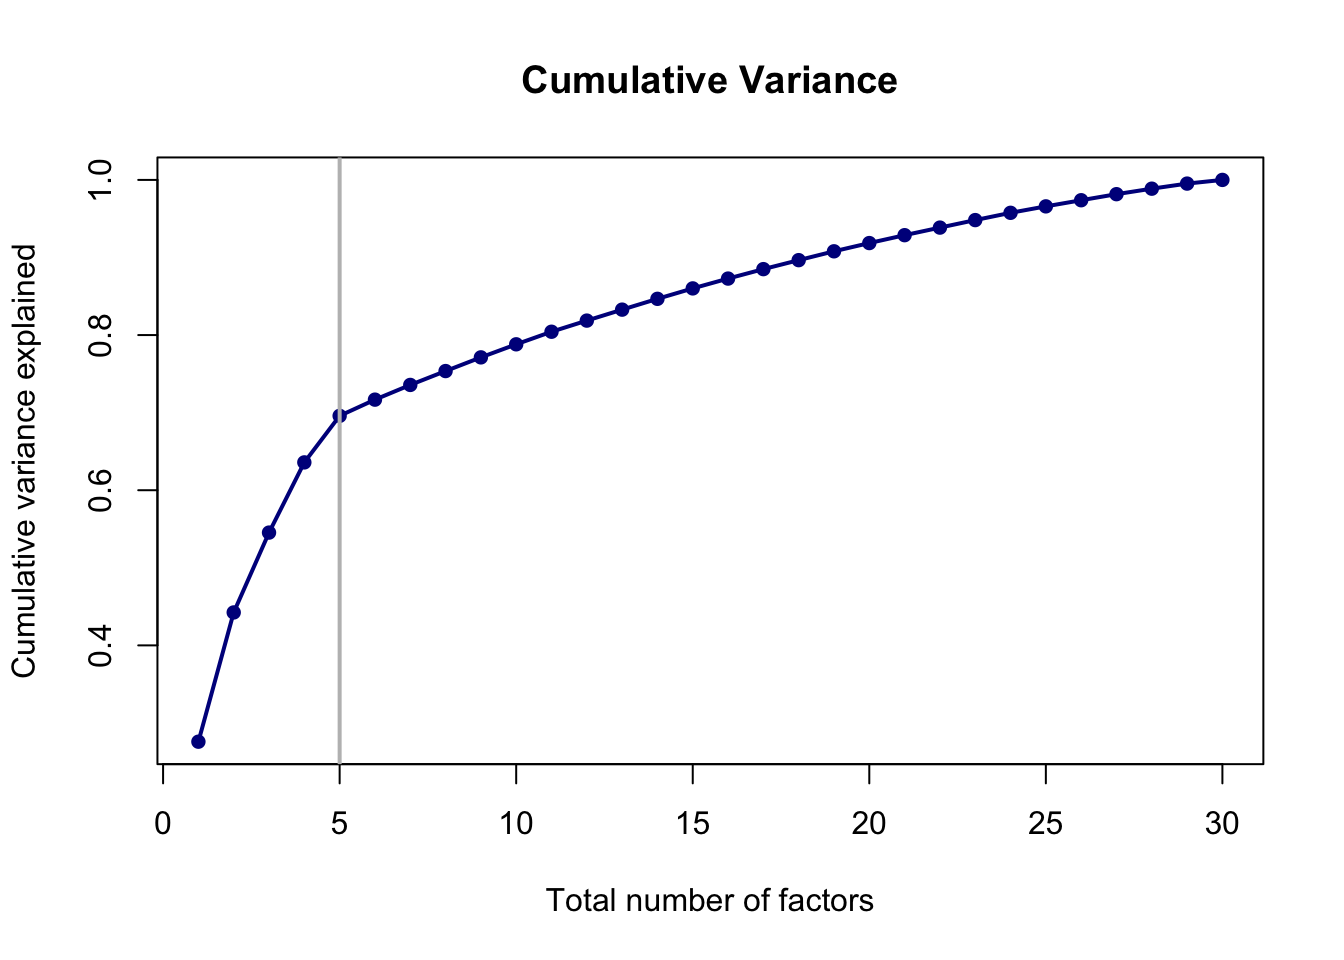
3.2 Extract Principal Factors
EFA <- psych::fa(
  r = cor,
  # number of factors
  nfactors = nFactor,
  # principal factor
  fm = "pa",
  # maximizes the sum of the variance of the squared loadings
  rotate = "varimax"
)
3.3 Factor Loadings
columnOrder <- c("PA1", "PA2", "PA3", "PA4","PA5","Communality","Uniqueness")

EFA_loadings <- data.frame(EFA$loadings[,]
                           ) %>%
  dplyr::mutate(Uniqueness = EFA$uniquenesses,
                Communality = EFA$communality) %>%
  dplyr::mutate(., across(where(is.numeric), round, 2)) %>%
  dplyr::select(columnOrder) %>%
  arrange(., -Communality)
EFA_loadings_DT = EFA_loadings %>%
tibble::rownames_to_column(., var="variable")
# PA cols
PACols = c("PA1", "PA2", "PA3", "PA4","PA5")
# color
colfunc <- colorRampPalette(c("darkblue", "lightgrey"))
# DT table
DT::datatable(EFA_loadings_DT ,
options = list(pageLength = 30)) %>%
formatStyle("PA1",
backgroundColor = styleEqual(sort(unique(EFA_loadings_DT $PA1),
decreasing = TRUE),
colfunc(length(
unique(EFA_loadings_DT $PA1)
)))) %>%
formatStyle("PA2",
backgroundColor = styleEqual(sort(unique(EFA_loadings_DT $PA2),
decreasing = TRUE),
colfunc(length(
unique(EFA_loadings_DT $PA2)
)))) %>%
formatStyle("PA3",
backgroundColor = styleEqual(sort(unique(EFA_loadings_DT $PA3),
decreasing = TRUE),
colfunc(length(
unique(EFA_loadings_DT $PA3)
)))) %>%
formatStyle("PA4",
backgroundColor = styleEqual(sort(unique(EFA_loadings_DT $PA4),
decreasing = TRUE),
colfunc(length(
unique(EFA_loadings_DT $PA4)
)))) %>%
formatStyle("PA5",
backgroundColor = styleEqual(sort(unique(EFA_loadings_DT $PA5),
decreasing = TRUE),
colfunc(length(
unique(EFA_loadings_DT $PA5)
)))) %>%
formatStyle(PACols, color = "white")3.4 Factor Scores
# extract rotated factor scores
EFA.scores = factor.scores(vars[,-1],
                           unclass(EFA$loadings))$scores


DT_cols  = c("PA1","PA2","PA3","PA4","PA5")
subjectValue =microvan$subjnumb

EFA.scores %>%
  as.data.frame() %>%
  mutate(subjnumb = subjectValue )%>%
  select(subjnumb, everything())%>%
  head(10) %>%
  DT::datatable(caption = "Top 10 subjects",rownames = F)  %>%
  DT::formatRound(columns=DT_cols , digits=2)